Understanding Fund Fact Sheets
Key Takeaway
Fund fact sheets provide information on a fund’s objectives, holdings, fees, and past performance and can be used to compare funds within the same category, learn more about a single fund, or contrast funds in different categories.
It might be tempting to focus on the Performance and Calendar Year Returns in making your decisions, but past performance is no guarantee of future results. Consider your diversification goals, risk tolerance, and investment time frame when making your decision.
- 1
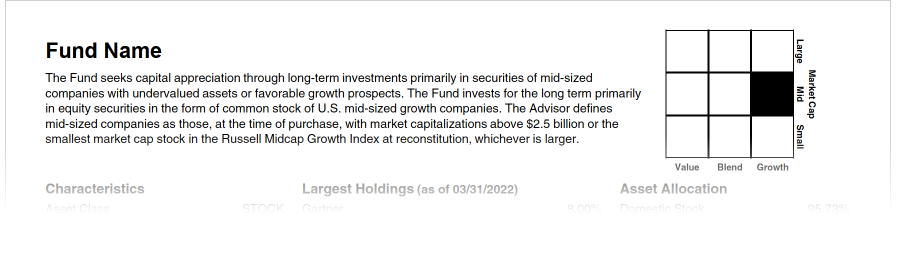
Fund Name and Description
The description provides a short summary of the fund’s objective and what types of securities it invests in.
- 2
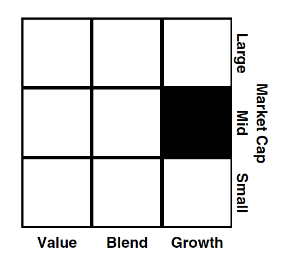
The Style Box
The style box places the fund into 1 of 9 classes by Market Cap and Style.
Market Cap: The size of companies the fund invests in
- Large Cap
- Mid-Cap
- Small Cap
Style: How the fund is categorized
- Value Funds: Contain stocks of companies the managers believe are underpriced and expected to rebound
- Blend Funds: Include both Growth and Value stocks
- Growth Funds: Contain stocks of companies whose earnings are expected to grow faster than the market
- 3
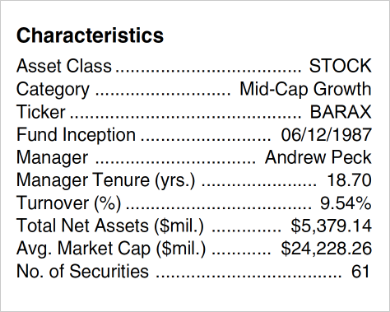
Characteristics
Ticker Symbol: This symbol can be used to search for additional information on the fund through the general internet or the fund company’s website.
Turnover: Shows the percentage of securities bought and sold within one year. Funds with high turnover rates can incur more transaction costs than those with lower turnover rates.
Total Net Assets: Shows the size of the fund. Combined with the Number of Securities in the fund, this illustrates the fund’s diversification. A very large fund with a relatively small number of holdings is less diversified than a smaller fund with more.
- 4
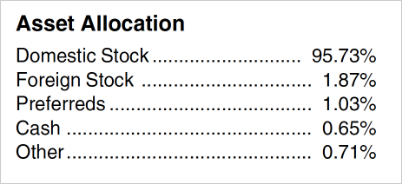
Asset Allocation
Displays the percent of stocks, bonds, cash, and other types of securities the fund may hold and offers a quick way to determine what the fund invests in.
- 5
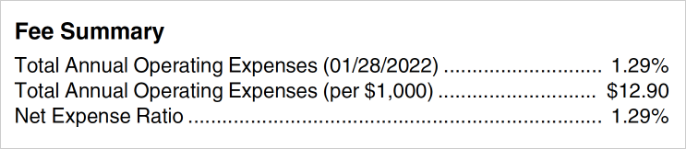
Fee Summary
The fee summary provides the Net Expense Ratio. This is the percentage you pay toward the mutual fund’s operating costs. In general, a lower Net Expense Ratio is better as the Net Expense Ratio is subtracted from the fund’s returns to the investor.